Introducing Code Tuner

Built for Product Owners who don’t read code, but own the outcome

Keep features flowing, prove progress to leadership, and call out blockers early, without getting lost in pull‑request jargon.

Integrating with

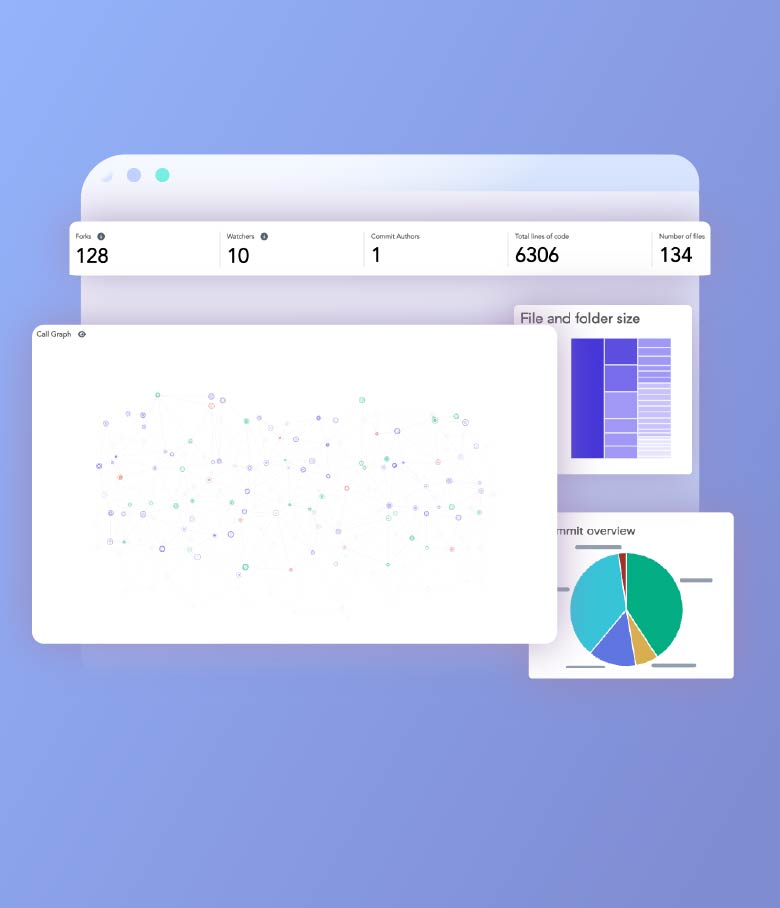
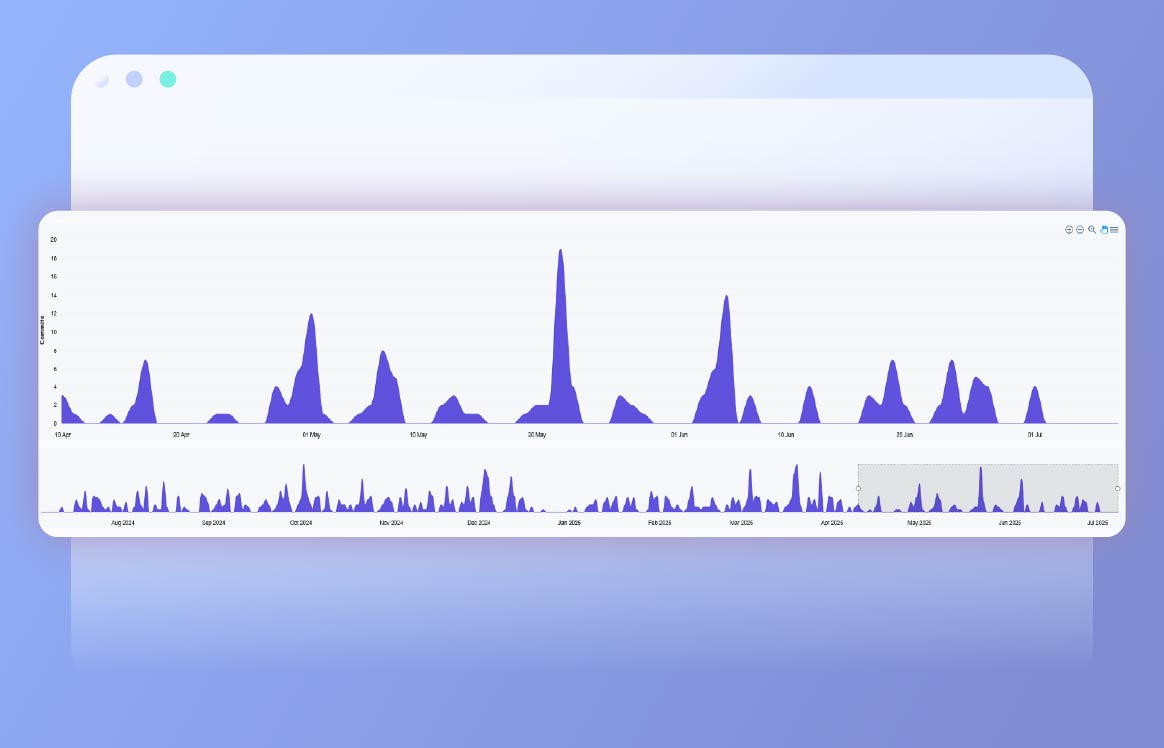
Real‑time clarity on what’s shipping (and what’s stuck)

Objective productivity metrics you can share with stakeholders

Works out‑of‑the‑box with Java codebases on GitHub / GitLab

Guided, zero‑code setup in minutes

Find the landmines, ship on time

CodeTuner shines a light on hidden work, creeping scope, and silent blockers so every feature lands when promised.

Live view
Live dashboard shows progress vs. plan at a glance
Integration
Integrates with GitHub / GitLab (Java projects) and Trello

Lack of transparency is the hidden cost centre

When you can’t see what’s really happening, estimates balloon, trust erodes, and delivery dates slip.

Let Your Source Code Do The Talking

If any of these feel familiar, it’s time for a clearer lens.

“One‑hour tweaks” stretch into multi‑week mini‑projects
Sprint burndown looks fine - but demo day feels thin
Pull‑request ping‑pong keeps stories in review longer than in dev

Built for product owners, not prompt engineers

ChatGPT can explain a snippet; CodeTuner turns code, commits, and tickets into business‑ready trends, continuously.

Repo‑wide, always‑on analytics
Refresh dashboards from GitHub & GitLab.
Productivity & value metrics
velocity, flow efficiency, review churn, and scope change - signals LLMs can’t compute from a single file.
Outcome alignment
Links code work to user stories & KPIs so you track ROI, not just syntax.
Enterprise Tier data protection
Encrypted connectors keep source private - no copy‑paste to public LLMs.

Clarity designed for fast‑moving product teams

SaaS, fintech, and scale‑ups can use CodeTuner to keep delivery honest.

See flow, not just tasks

Stream metrics expose bottlenecks from backlog to prod.

  • See cadence trends from history charts
  • Colour-coded diagrams show team and contributor commit histories
  • Historic trends show whether changes stick

Watch your roadmap light up in real time

Interactive radar instantly shows which work‑streams need attention.

  • Pulls Java Source Code data from GitHub & GitLab
  • Check number of Code Smells (indicators of design defects)
  • Click diagram elements to drill down into data panel
Get started free

Show effort, celebrate wins

Objective insights remove doubt and reward real progress.

Contribution commit graph surfaces unsung heroes.
Spotlight modules starving for attention.
Understand where roadblocks may be hindering progress

Compare teams, spot risks across every repo

One dashboard surfaces cadence & debt across all products—no matter how many repositories or time zones.

Multiple repository heatmaps reveal hotspots in each codebase at a glance
Metrics (velocity, PR churn, defect density) let you compare teams and products
Portfolio dashboard prioritises subsystems where debt threatens delivery
Analytics Default Icon Techdash X Webflow Template | Brix Template

Product owners who moved from guesswork to clarity

From opaque progress to predictable releases in two sprints.

“The complexity heatmaps were clear and helpful.” - Lead Dev.
“I haven't seen a tool for this type of visualisation before.” - SaaS CTO
“The analysis of the codebase is a really valuable asset” - Startup CTO

Bring clarity to your next sprint

14‑day full‑feature trial - no credit card required.

Step 1

Enter name and work email

Step 2

Sign into GitHub / GitLab account

Step 3

Select Java Repository and analyse code for insights
Get started today

Request a Demo

Thanks for submitting.
Oops! Something went wrong.